Key points:
-
Bitcoin bulls face multiple resistances as price stays stuck, but some see upside liquidity sparking a short squeeze.
-
BTC price forecasts continue to see lower levels closer to $109,000 in the short term.
-
Volatility is all but guaranteed to return, and traders now need “patience.”
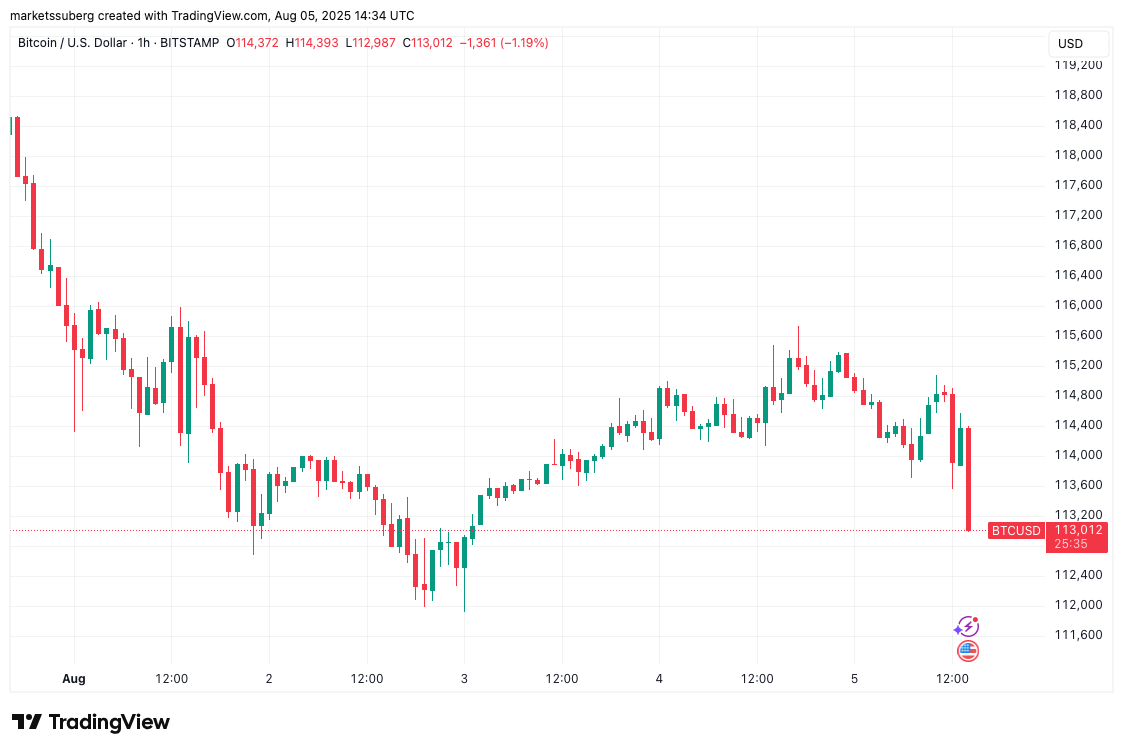
Bitcoin (BTC) struggled to hold $113,000 after Tuesday’s Wall Street open as analysis expected new lows.

$109,000 area becomes new BTC price target
Data from Cointelegraph Markets Pro and TradingView showed BTC price action wedged between areas of high order-book liquidity.
Room for movement was thus limited, and short-term forecasts favored further downside next.
“$BTC is going lower before it goes higher,” trading resource Material Indicators summarized in a post on X.

An accompanying chart of BTC/USDT order-book liquidity on largest global exchange Binance revealed a lack of significant bid support above $110,000.
Continuing, onchain analytics firm Glassnode eyed the cost basis of recent Bitcoin buyers, likewise suggesting that the area around old all-time highs could provide a BTC price floor.
“For $BTC, the airgap between $109K–$116K is gradually being filled on dips. The staircase pattern points to steady investor engagement over the past month,” it explained on the day.
“So far, we see limited distribution from the $118K–$120K range, suggesting these holders are opting to hold through.”

Not everyone was concerned about a more significant BTC price dip.
Analyzing liquidity, popular X account TheKingfisher stressed the allure of overhead asks.
“Look at $BTC – almost 70% of liquidations are shorts sitting above us,” part of an X post read alongside a chart of crypto long and short distributions.
“That means there’s a massive pool of fuel waiting to be gobbled up. Institutions love playing with these liquidity hotspots. We’re watching for that flush.”

Bitcoin volatility “on the horizon again”
Popular trader Daan Crypto Trades meanwhile eyed resistance in the form of the 200-period simple (SMA) and exponential (EMA) moving averages on 4-hour timeframes.
Related: Bitcoin treasuries add 630 BTC while ETFs shed $300M as price ranges
“Bulls need to break this region to be back in control and start aiming for higher,” he argued.

Crypto trader, analyst and entrepreneur Michaël van de Poppe said that regardless, rangebound BTC price behavior would not last.
“Patience is required when it comes to $BTC. No breakout upwards, no breakout downwards,” he concluded Tuesday.
“Volatility slowing down, which means a big move is on the horizon again.”

This article does not contain investment advice or recommendations. Every investment and trading move involves risk, and readers should conduct their own research when making a decision.